 RSS Feed


 June 12th, 2017
  Awake Goy
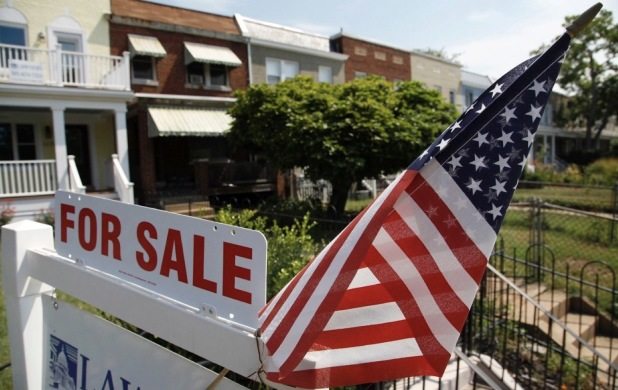
 In April 2017, US new home sales dropped after surging in March.
The seasonally adjusted rate of new home sales in April was reported at 569K according to the Commerce Department. Analysts were anticipating an increase in the region of 610K. Sales of US single-family homes were 842K in May 2007.
That plunged to 336K by January 2009 and hit a low of 270K in February 2011.
Since then, the US economy has rebounded strongly, with sales of new single-family homes increasing at a strong seasonally adjusted annual rate. Consider that in March 2017, the pace increased to 642K before the pullback. While April new home sales pale in comparison to March, they are still 0.5% better year on year.
Is the US Real Estate Market Declining?
Given that there is a 10.5% margin of error for the figures, the data could either read 628.75K on the high-end or 509.25K on the low end. It is likely that the actual figures will be revised to a degree. Several leading economists are not convinced that the April new home sales readings are cause for concern yet. There is a degree of optimism that the figures from May will prove bullish and that new-home sales will rebound during the summer months.
The data provides a compelling case for declining sales across each of the 4 regions in the country. Month on month declines were sharpest in the West (-26.3%). The Midwest (-13.1%) was equally bearish. Part of the reason for declining sales at current prices is increasing supply of new homes. There are now 5.7 months worth of supply at current prices – marking the highest level in almost 2 years.
The median sales price of a new home in the US has decreased from $321,300 a year ago to a price of $309,200. This is standard with a slowdown in new home sales, as markets try to reach an equilibrium price point between demand and supply. Another factor that is weighing on new home sales is interest rates. The Fed has raised rates multiple times since the global financial crisis, and is on track to hike rates on Wednesday, June 14, 2017.
Existing homeowners are also cashing in on customer friendly interest rates before the Fed reaches its pre-stated goal of 3% – 4% by 2019. Since investments in real estate are geared towards higher appraisal prices, homeowners are applying home improvement tips to enhance the aesthetics, cost efficiency, and functionality of their homes.
Fed Rate Hikes Important for Property Market
According to the CME Group, the likelihood of a rate hike in June is now 96.9%. This means that the probability of the federal funds rate increasing in the region 1.00% – 1.25% is 96.9%. Higher interest rates increase the cost of mortgages and serve to raise the inflation rate in the economy. This will invariably cause housing prices to rise.
The probability of a rate hike with the Fed FOMC on May 31, 2017 was 90%. The US economy has produced mixed data, with record low levels of unemployment (4.3%), but slightly disappointing NFP data. The USD has retreated on the back of this news, but a Fed rate hike is bound to bolster the greenback.
Demand for US housing has remained robust, notably for cost-effective, starter homes. Unfortunately, construction has been unable to maintain pace with demand. Various listed construction companies have enjoyed a sharp appreciation in stock prices as a result of increasing demand for new single-family homes in the US. For example, the iShares US construction ETF has appreciated by 20.10% for the year to date, and has reported an average 5-year return of 18.84%. Clearly, there is more bullish sentiment than the data presents.
Source Article from http://www.hangthebankers.com/what-is-the-sharp-drop-in-us-new-home-sales-attributed-to/
 Posted in
  Tags:
Tags: 


