 RSS Feed


 February 28th, 2021
  Awake Goy
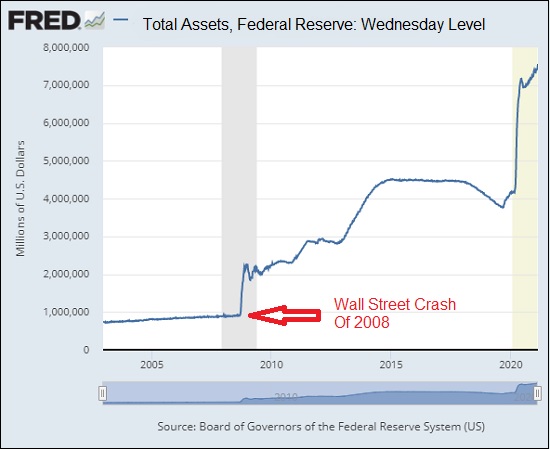
What has changed the course of economic history in the United States and put the country on a debt-fueled disaster course is the Wall Street crash of 2008 and the bailouts, both monetary and fiscal, that have followed ever since
By Pam Martens and Russ Martens of Wall Street on Parade.
Every Thursday, at approximately 4:30 p.m., the Federal Reserve provides a report on its balance sheet as of the prior day. It’s known as the H.4.1 report or the Wednesday Level report.
On Thursday, September 4, 2008, the Fed’s H.4.1 report showed a $935 billion balance sheet as of Wednesday, September 3, 2008. That was 12 days before iconic financial institutions on Wall Street began to blow up in what became the worst financial crisis since the Great Depression. As of last Wednesday, February 17, 2021, the Fed’s balance sheet stood at $7.6 trillion – an increase of 712.83 percent in less than 13 years.
The Federal Reserve was created in 1913 and such a staggering growth in its balance sheet has not occurred at any other period in U.S. history — not during the Great Depression, not even during or after World War II.
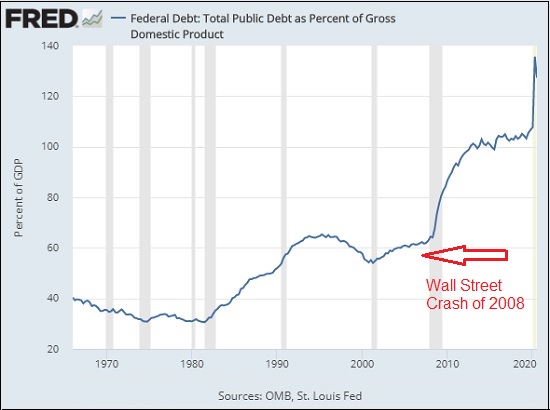
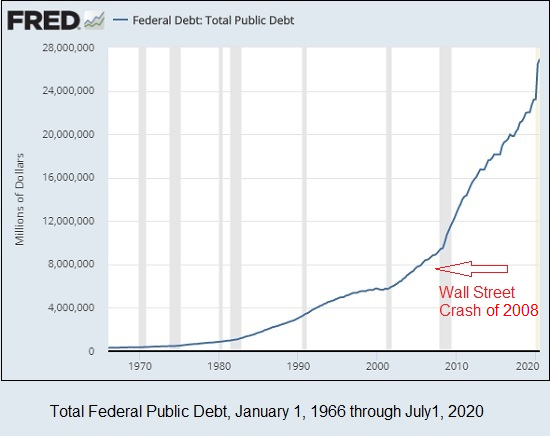
What has changed the course of economic history in the United States and put the country on a debt-fueled disaster course is the Wall Street crash of 2008 and the bailouts, both monetary and fiscal, that have followed ever since, together with the unwillingness of Congress to confront this reality.
The charts above showing the unprecedented growth in the federal debt and federal debt versus GDP since the Wall Street crash of 2008 confirm this thesis…
 Posted in
  Tags:
Tags: 


