 RSS Feed


 September 28th, 2023
  Awake Goy
 “9-Sigma Miss”: Personal Consumption “Unexpectedly” Collapses In Latest GDP Revision
Traditionally, the second revision to GDP data (which comes three months after the end of a given quarter) is a boring, subdued affair… except for once every five years when alongside the latest data revisions, the BEA (the B usually stands for Bureau but in this case it may as well stand for Biden’s) also publishes a wholesale revision of all GDP going back some two decades. Today was one of those time, and boy was it a doozy.
As we warned one week ago in “Ignore The Hawkish Fed: Not Only Is GDP About To Tumble, Next Week It Will Be Revised Sharply Lower“, moments ago the Bureau of Economic Analysis published Q2 GDP data which – at least at the headline level – was largely in line with previous numbers and expectations, printing at 2.1%, the same as the previous revised estimate published in August and just below the consensus estimate of 2.2% (range 2% to 2.5% from 54 economists).
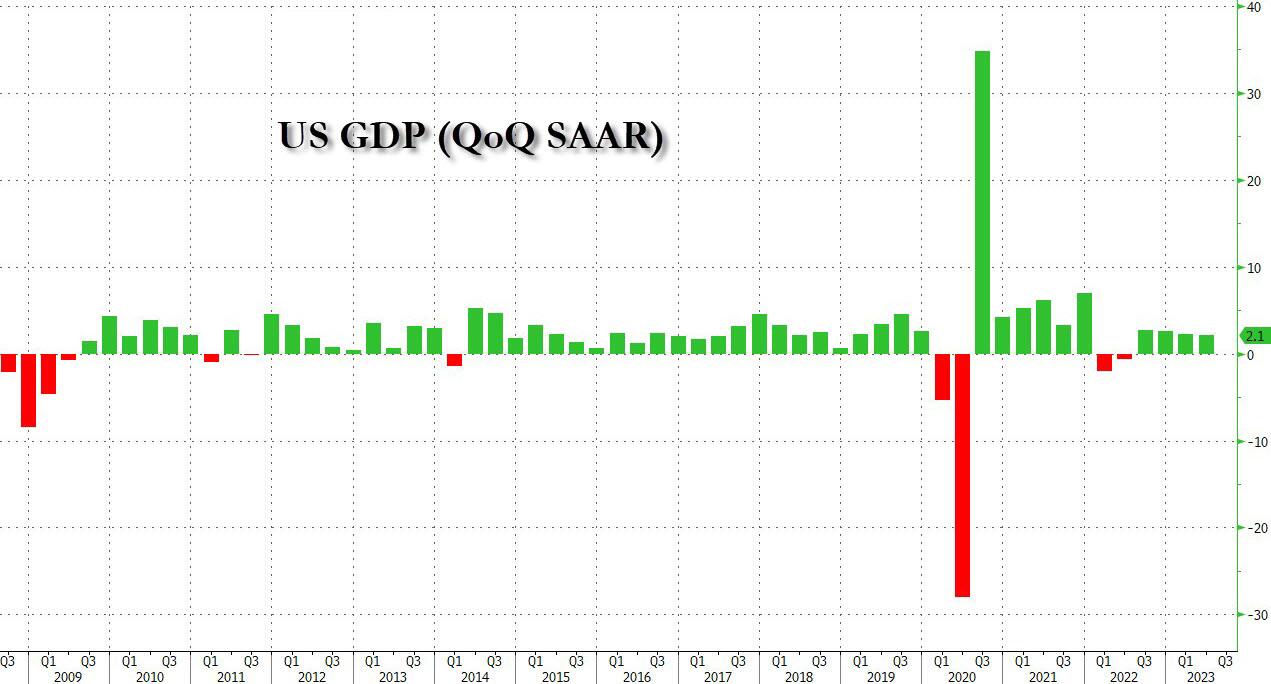
So were we wrong? Not really, because while the headline GDP number was as expected, the most important component to US GDP, personal consumption was nowhere near as expected. In fact, printing at 0.8%, down 80% from 3.8% in Q1, it was a downright disaster.
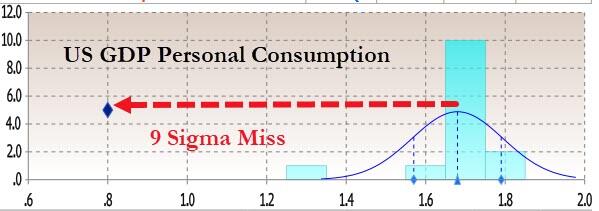
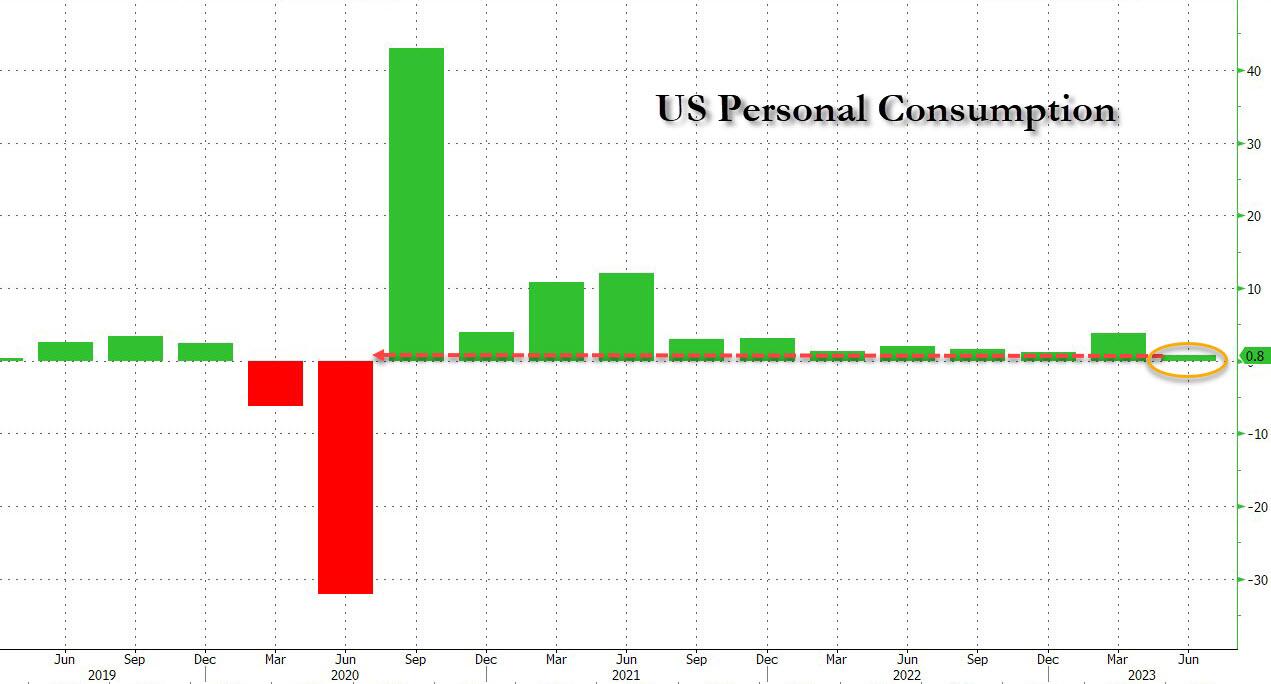
As shown in the chart below, Personal Consumption was expected to print unchanged from the 1st revision to Q2 GDP at 1.7%. Instead, it came in less than half at 0.8%, a 9-sigma miss to expectations!
Furthermore, at a sharply downward revised print, the Q2 GDP consumption was not only the first sub-1% print since September 2020, it was the lowest consumption going back to the covid quarter, Q2 2020.
Confirming this, the BEA coyly put it as follows:
The update from the “second” estimate primarily reflected a downward revision to consumer spending that was partly offset by upward revisions to business investment, exports, and inventory investment. Imports were revised down.
Of course, when it comes to the US economy which is 70% spending-driven, all that matters is consumer spending, and the sudden collapse there confirms what we have been saying: the US is about to careen into economic contraction once the various factors that will slam Q4 GDP come into play including:
- the resumption of student loan payments, which will subtract (at least) 0.5% (and likely much more) from quarterly annualized GDP growth
- the federal government shutdown, which will reduce quarterly annualized growth by around 0.2% for each week it lasts
- reduced auto production from the ongoing UAW strike which will reduce quarterly annualized growth by 0.05-0.10% for each week it lasts.
Taking a closer look at the components of Q2 GDP we get the following picture, courtesy of the highly politicized BEA which waited two months after the end of the quarter to tell us that the state of the US consumer was less than half as strong as expected:
- The increase in business investment reflected increases in structures, equipment, and intellectual property products.
- The increase in consumer spending reflected increases in both services (led by health care, as well as financial services and insurance) and goods (led by recreational goods and vehicles, as well as gasoline and other energy goods).
- The increase in state and local government spending reflected increases in investment in structures and compensation of state and local government employees.
- The decrease in exports reflected a decrease in goods (led by industrial supplies and materials; consumer goods, except food and automotive; and foods, feeds, and beverages) that was partly offset by an increase in services (led by travel).
While it is largely irrelevant since all the historical data was also revised, compared to the first quarter, the deceleration in GDP in the second quarter primarily reflected a deceleration in consumer spending, a downturn in exports, and a deceleration in federal government spending. These movements were partly offset by an upturn in inventory investment, an acceleration in business investment, and a smaller decrease in housing investment. Imports turned down.
Quantifying the changes in Q2, we get the following picture:
- Personal Consumption contribution to the change in GDP was just 0.55%, down more than half from 1.14% in the last revision, and down massively from 2.54% in Q1
- Fixed investment was where the BEA plugged the consumption hole, and despite continued cuts in CapEx, fixed investment magically boosted Q2 GDP by 0.9%, up from 0.66% in the previous revision,
- The change in Private Inventories was exactly 0.00%, almost as if it was fat fingered, although considering it was -0.09% in the previous revision, it’s somewhat credible.
- Net Exports were also used by the BEA to incredulously boost GDP because somehow, despite the soaring dollar, net exports contributed 0.04% to the bottom line GDP number (exports -1.09% vs imports 1.13%), up from a -0.22% detraction previously. How this is possible, again, with the dollar surging is anyone’s guess.
- Finally, government consumption was largely unchanged from the previous estimate, and at 0.57% it contributed just over a quarter to the bottom line GDP print of 2.06%.
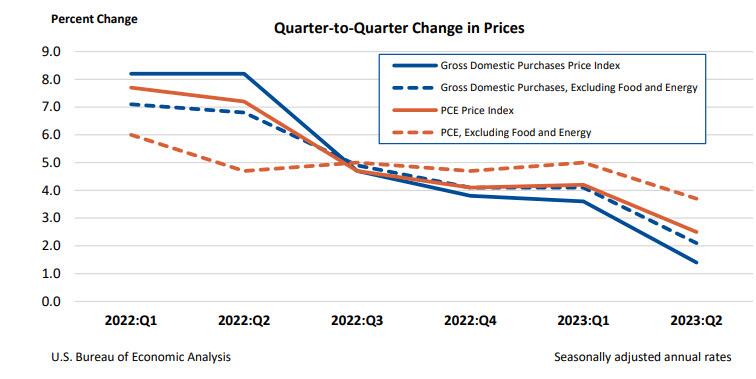
Of far lower importance was the latest price data, which showed a headline GDP price index of 1.7%, down from 2.0% in the previous revision. Excluding food and energy, the PCE “core” price index increased 3.7%, unchanged from the last revision and in line with expectations, after increasing 5.0 percent.
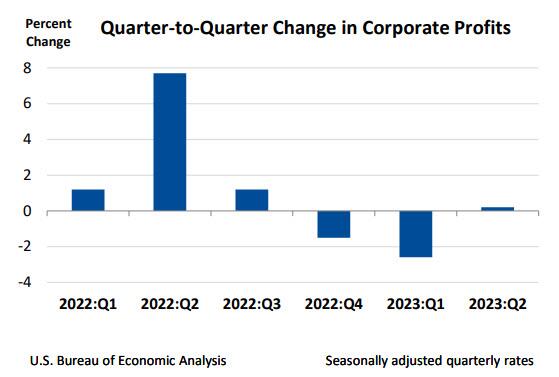
Finally, looking at corporate profits, the BEA reported that profits increased 0.2 percent at a quarterly rate in the second quarter after decreasing 2.6% in the first quarter; this was the first positive quarter since Q3.
- Profits of domestic financial corporations decreased 10.9 percent after increasing 3.6 percent.
- Profits of domestic nonfinancial corporations increased 1.8 percent after decreasing 4.1 percent.
- Profits from the rest of the world (net) increased 4.5 percent after decreasing 1.6 percent.
Corporate profits decreased 2.7 percent from the second quarter one year ago
Finally, as a reminder, here is the main reason why today’s GDP report actually matters:
Comprehensive Update of the National Economic Accounts
Today’s release presents results from the comprehensive update of the National Economic Accounts (NEAs), which include the National Income and Product Accounts (NIPAs) and the Industry Economic Accounts (IEAs). The update includes revised statistics for GDP, GDP by industry, GDI, and their major components. Current-dollar measures of GDP and related components are revised from the first quarter of 2013 through the first quarter of 2023. GDI and selected income components are revised from the first quarter of 1979 through the first quarter of 2023.
We will now take a closer look at the various GDP revisions and share the data in a subsequent post.
Tyler Durden
Thu, 09/28/2023 – 09:13 Source
 Posted in
  Tags:
Tags: 


