 RSS Feed


 October 17th, 2023
  Awake Goy
 BofA Reports Best Ever Q3 Earnings Even As Held-To-Maturity Losses Soar By $26 BIllion To Record HiIgh
Bank of America, the second largest US bank, was the latest big money-center bank to report earnings this morning, and in keeping the trend started by JPM, Wells and Citi last Friday, it not only beat expectations, but reported Q3 numbers that were the strongest in at least seven years as net interest income topped analysts’ estimates as the lender continues to reap the benefits of Federal Reserve interest-rate hikes and market swings.
Here are the highlights:
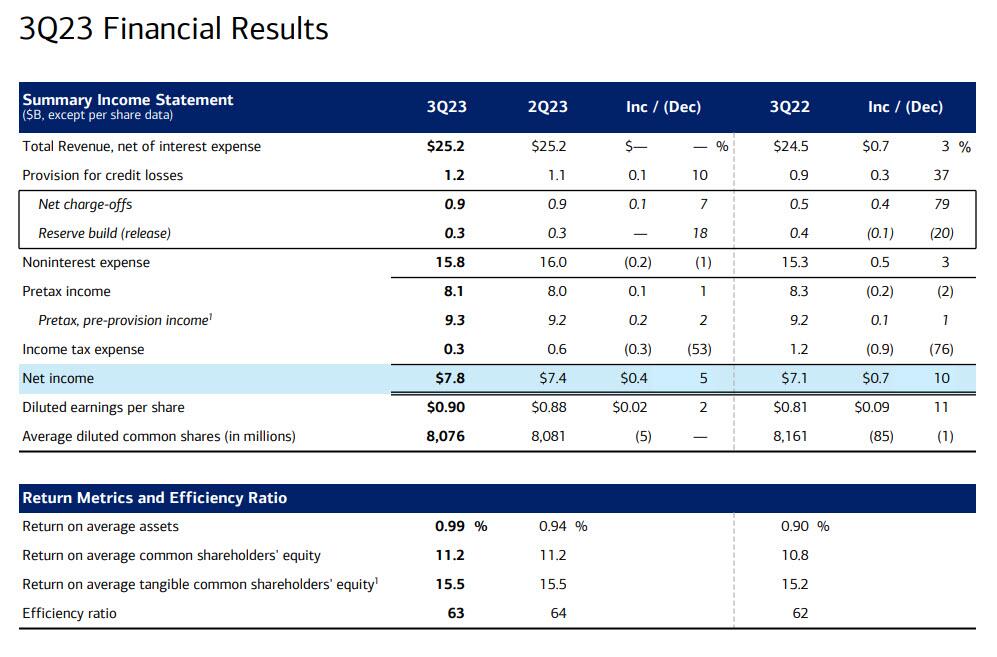
- Q3 revenue $25.17BN, up 3% YoY from $24.5BN and beating exp. of $24.94BN
- Q3 EPS $0.90, up 11% YoY from $0.81, and beating exp. of $0.82
“We added clients and accounts across all lines of business,” CEO Brian Moynihan said adding that “we did this in a healthy but slowing economy that saw US consumer spending still ahead of last year but continuing to slow.”
Looking at the bank’s Q3, here too it beat expectations across the board
- Return on average equity 11.2%, estimate 10.2%
- Return on average assets 0.99%, estimate 0.89%
- Return on average tangible common equity 15.5%, estimate 14%
- Basel III common equity Tier 1 ratio fully phased-in, advanced approach 13.5%, estimate 13.2%
- Standardized CET1 ratio 11.9%, estimate 11.7%
- Efficiency ratio 62.6%, estimate 62.9%
We’ll look at BofA’s non-interest income in a second but first this is how the bank took advantage of its massive balance sheet:
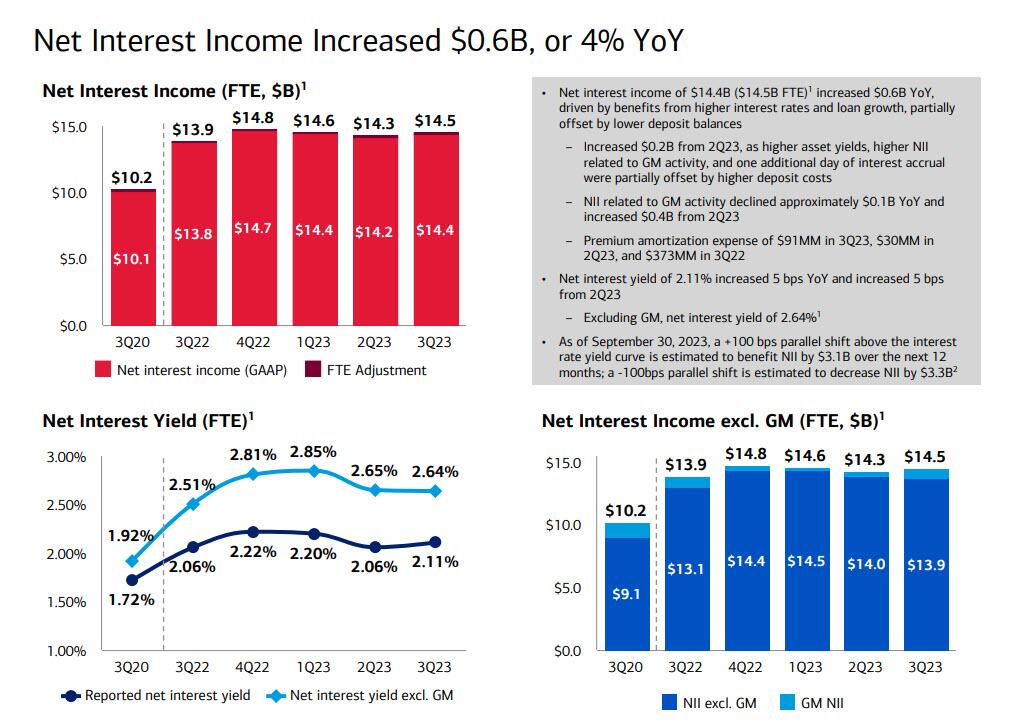
- BofA reported net interest income of $14.53BN, up from $13.9BN a year ago and beating estimates of $14.22BN.
- BofA’s Net interest yield of 2.11% increased 5 bps YoY and also increased 5 bps from 2Q23 and also beating the 2.06% median estmate; Excluding GM, net interest yield dropped from 2.65% to 2.64%
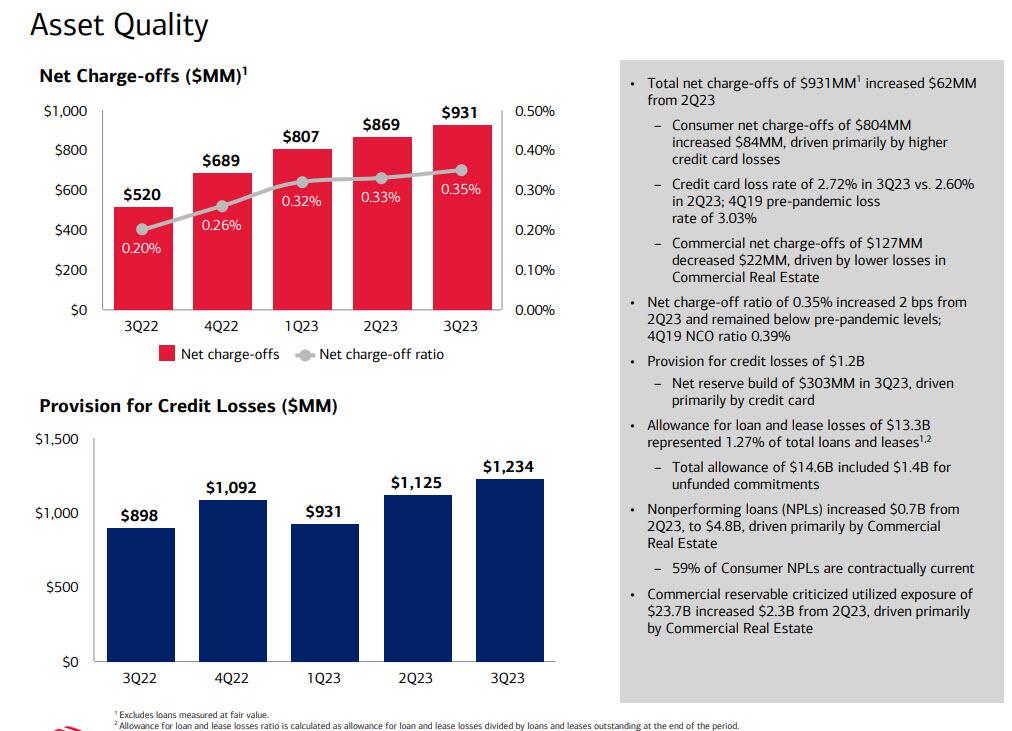
Looking at the bank’s charge offs, which will be a closely watched topic since Bank of America has one of the highest carried Held to Maturity losses of all banks, the bank reported net charge-offs of $931 million, below the estimate of $995.4 million while the provision for credit losses rose to $1.23 billion, but below the estimate $1.3 billion. Unlike JPM, BofA actually built reserves for future losses to the tune of $303 billion, “driven primarily by credit cards” which together with CRE is emerging as the biggest threat to the financial system. Some more details:
- Total net charge-offs of $931MM increased $62MM from 2Q23, but below the estimate $995.4 million
- Consumer net charge-offs of $804MM increased $84MM, driven primarily by higher credit card losses
- Credit card loss rate of 2.72% in 3Q23 vs. 2.60% in 2Q23; 4Q19 pre-pandemic loss rate of 3.03%
- Commercial net charge-offs of $127MM decreased $22MM, driven by lower losses in Commercial Real Estate
- Net charge-off ratio of 0.35% increased 2 bps from 2Q23 and remained below pre-pandemic levels; 4Q19 NCO ratio 0.39%
- Provision for credit losses of $1.2B;
- Net reserve build of $303MM in 3Q23, driven primarily by credit card
- Allowance for loan and lease losses of $13.3B represented 1.27% of total loans and leases
- Total allowance of $14.6B included $1.4B for unfunded commitments
Some more details:
- Nonperforming loans (NPLs) increased $0.7B from 2Q23, to $4.8B, driven primarily by Commercial Real Estate
- Commercial reservable criticized utilized exposure of $23.7B increased $2.3B from 2Q23, driven primarily by Commercial Real Estate
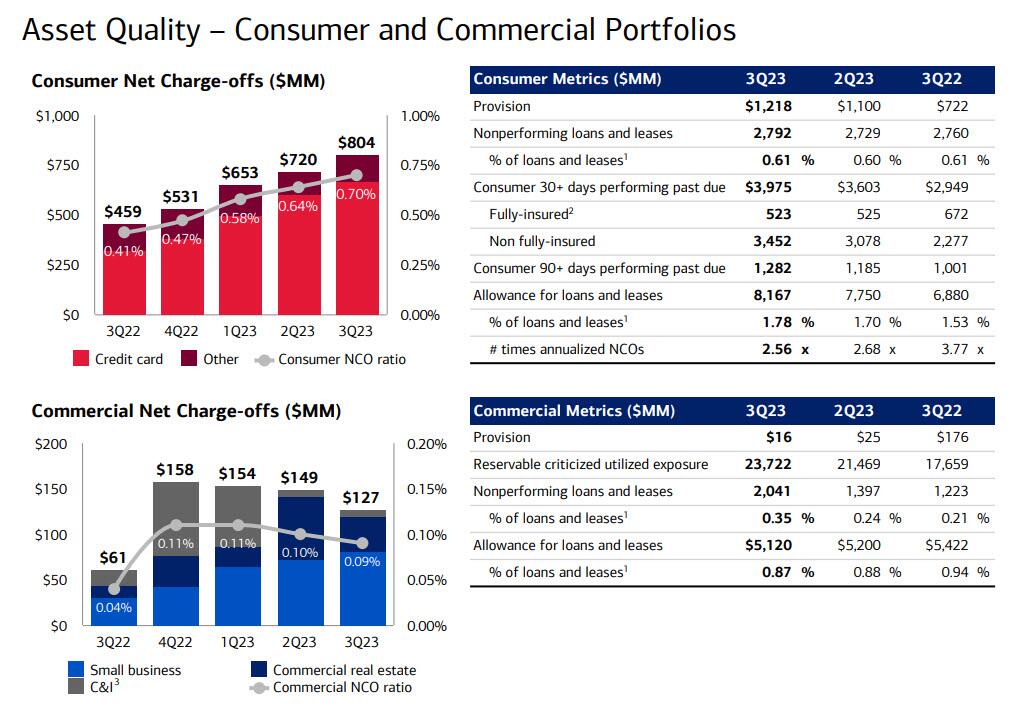
And another way to visualize the deteriorating credit card and CRE trends on the BofA balance sheet.
Of course, the one line item everyone will be asking about is the bank’s $131.6BN in HTM losses, which increased by $26BN from last quarter and is now the highest in BofA history!

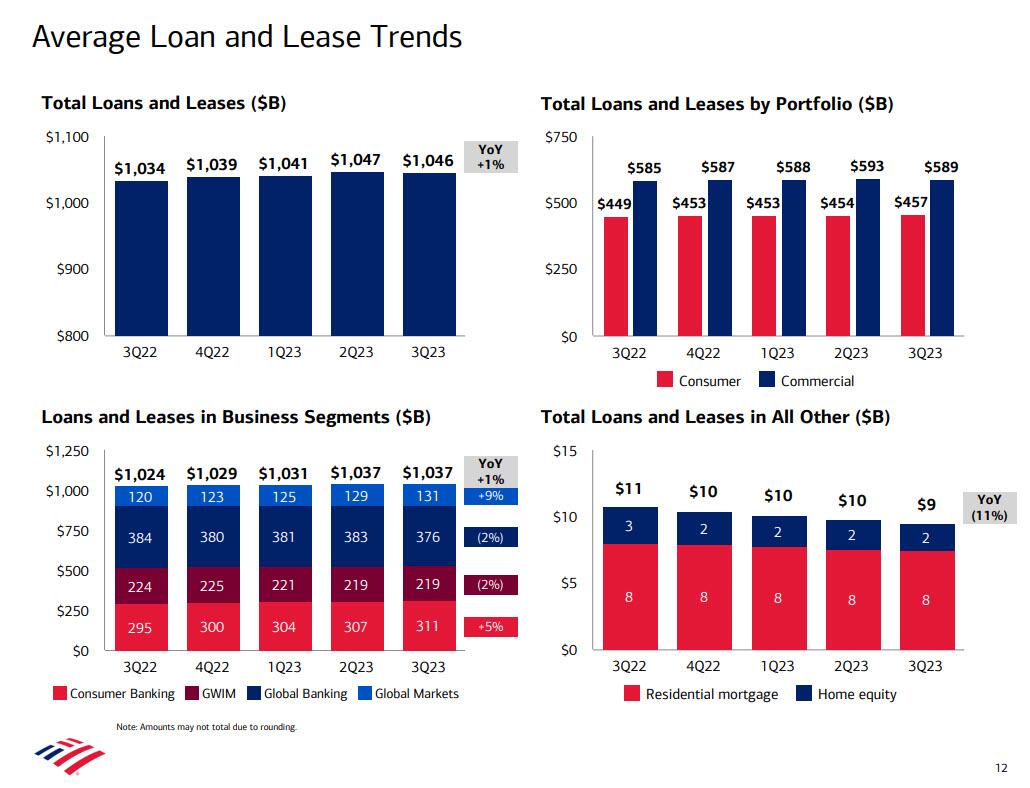
Another look at the balance sheet reveals average loans and leases of $1.05 trillion, in line with the estimate of $1.05 trillion…
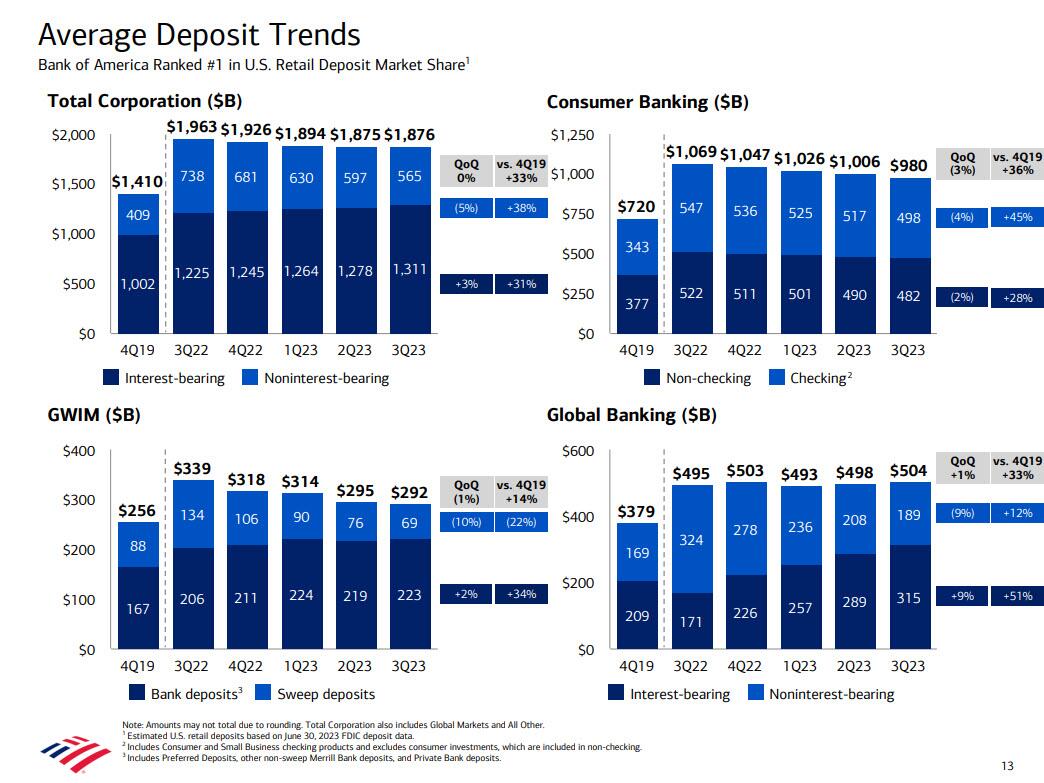
… while deposits were unchanged at $1.88 trillion, above the estimate of $1.77 trillion, but down from $1.96 trillion a year ago.
As has been the case lately, every bank is finally doing what we have been showing since 2012 when JPM’s excess deposits led to the London Whale disaster, and is disclosing how it is handling its “excess deposits over loans” which these days are mostly parked in deeply underwater (but HTM) treasuries. Here are the details:
- Deposits in excess of loans grew from $0.4T in 3Q19 and peaked at $1.1T in 4Q21; remained above $0.8T in 3Q23
- Excess deposits stored in cash and investment securities
- 53% HTM and 47% cash and AFS in 3Q23
- Cash levels remained well above pre-pandemic levels ($157B in 3Q19)
- AFS securities mostly hedged with floating rate swaps; duration less than 0.5 years and marked through AOCI1 and regulatory capital
- Invested net $33B in short-term US Treasuries in 3Q23
- HTM securities were $603 billion; these declined $80B since peaking at $683B in 3Q21; down $40B vs. 3Q22 and $11B vs. 2Q23. This is where all the deeply underwater TSY and MBS holdings are found.
- MBS of $474B down $11B vs. 2Q23; $129B UST / other flat
- Valuation declined 13% vs. 3Q22, as mortgage rates ended 3Q23 at highest level in almost 23 years

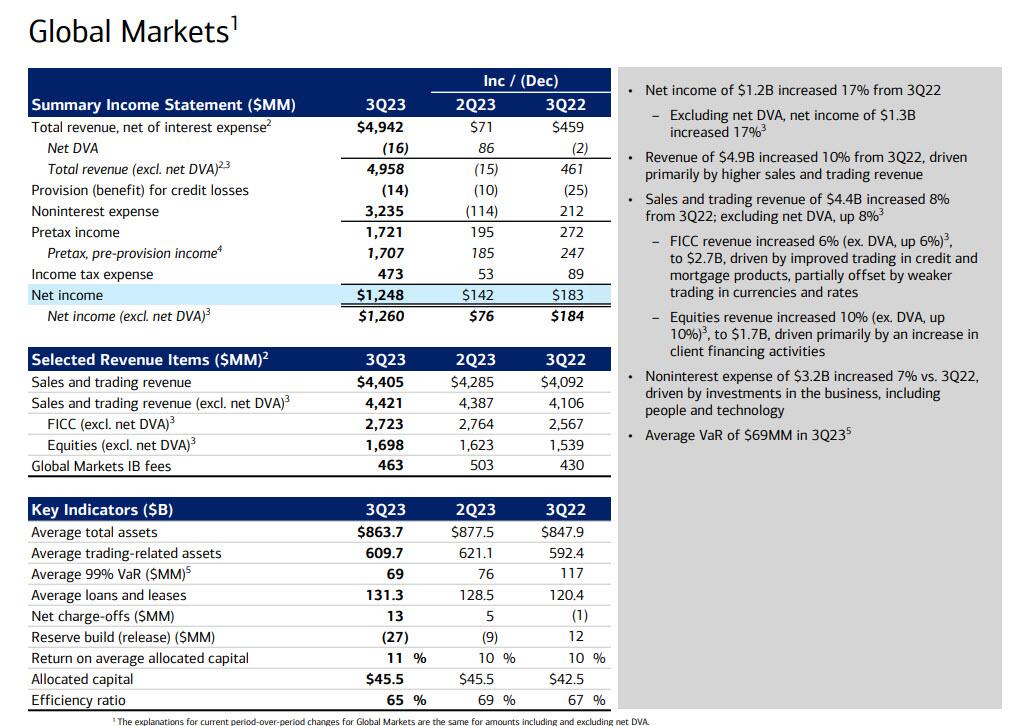
Turning to BofA’s Global Markets trading desk, the bank reported trading revenue ex DVA at $4.42BN, up 8% and beating the $4.16BN expected.
- FICC trading revenue excluding DVA $2.72 billion, beating estimates of $2.62 billion, and above the $2.57BN from a year ago, “driven by improved trading in credit and mortgage products, partially offset by weaker trading in currencies and rates”
- Equities trading revenue excluding DVA $1.70 billion, also beating estimates of $1.54 billion, and also above the $1.54BN from a year ago, “driven primarily by an increase in client financing activities“
- The average VaR dropped notably from 117 a year ago and 76 in Q2 to just 69 in Q3
- On the expense side of the ledger, noninterest expense in global market, of $3.2B increased 7% vs. 3Q22, driven by investments in the business, including people and technology.
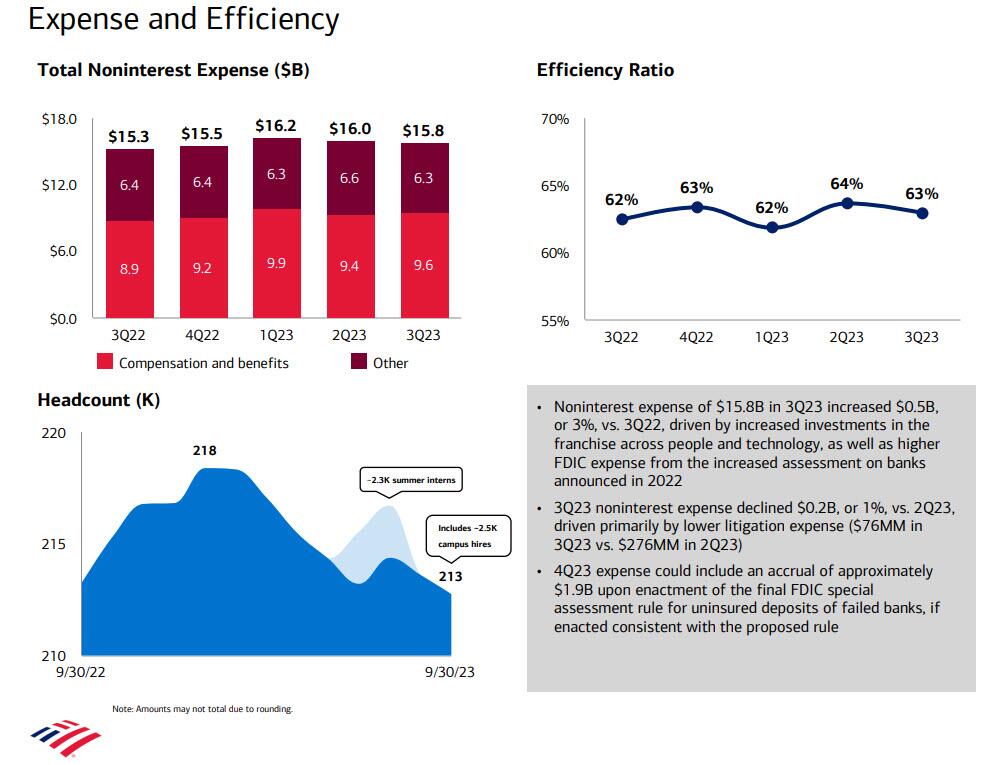
Taking a quick look at the company’s expenses, BofA reported that non-interest expenses rose 3.5% from a year earlier to $15.8 billion. Costs have been a focal point for investors, with persistent inflation putting pressure on spending and spurring wage growth. Analysts had expected a 3.3% increase. Broken down, compensation and benefits rose to $9.55 billion from $9.4 billion, above the estimated $9.34 billion; Other expenses dropped from $6.6BN to $6.3BN, resulting in an efficiency ratio of 63%, down from 64% but up from 62% a year ago.
The stronger than expected results offered another look at how US consumers and businesses are faring as the Fed leaves borrowing costs higher for longer than economists had predicted. Last week, JPM, Wells Fargo and Citi beat analysts’ expectations for net interest income and raised their forecasts for the remainder of the year.
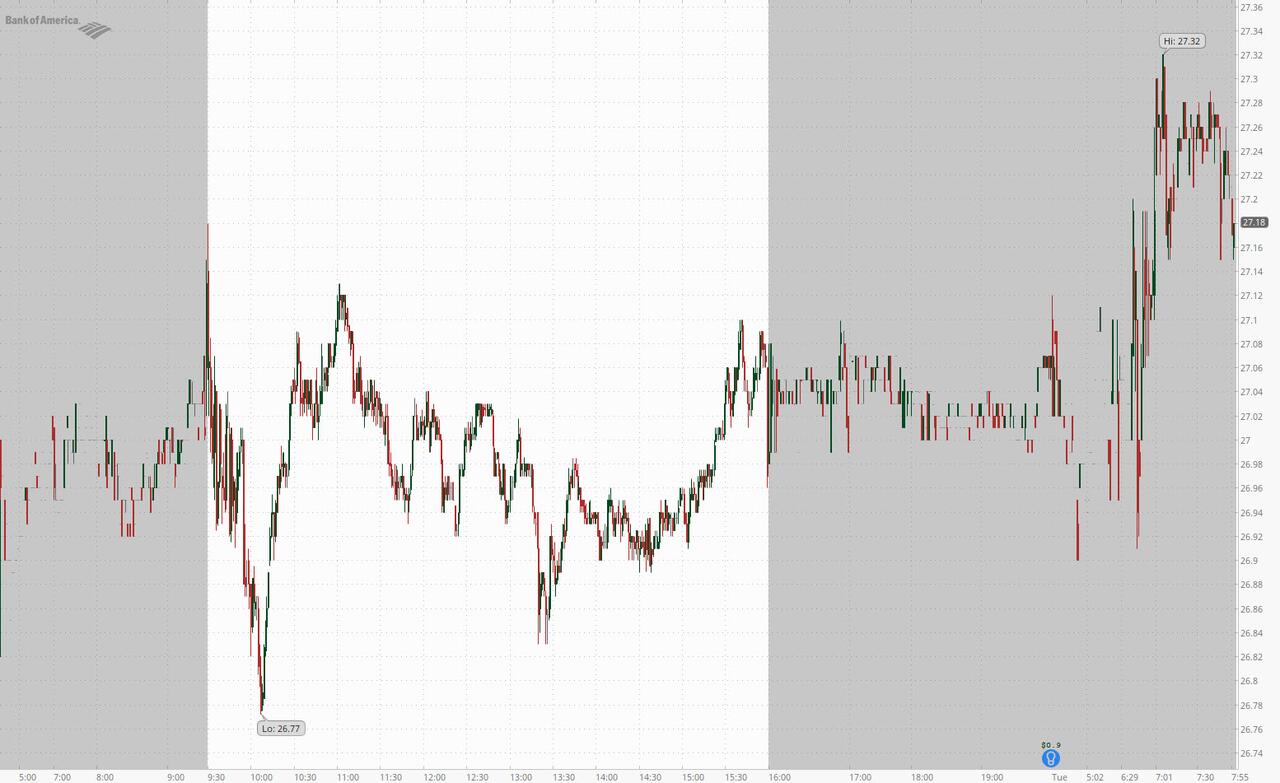
Shares of the Charlotte, North Carolina-based bank which were down 19% this year through Monday, rose 0.7% to $27.19 at 8 a.m. in early New York trading as attention has yet to turn to the aggressive deterioration in the bank’s books.
The company’s full Q3 presentation is below (pdf link)
Tyler Durden
Tue, 10/17/2023 – 08:13 Source
 Posted in
  Tags:
Tags: 


