 RSS Feed


 November 10th, 2021
  Awake Goy
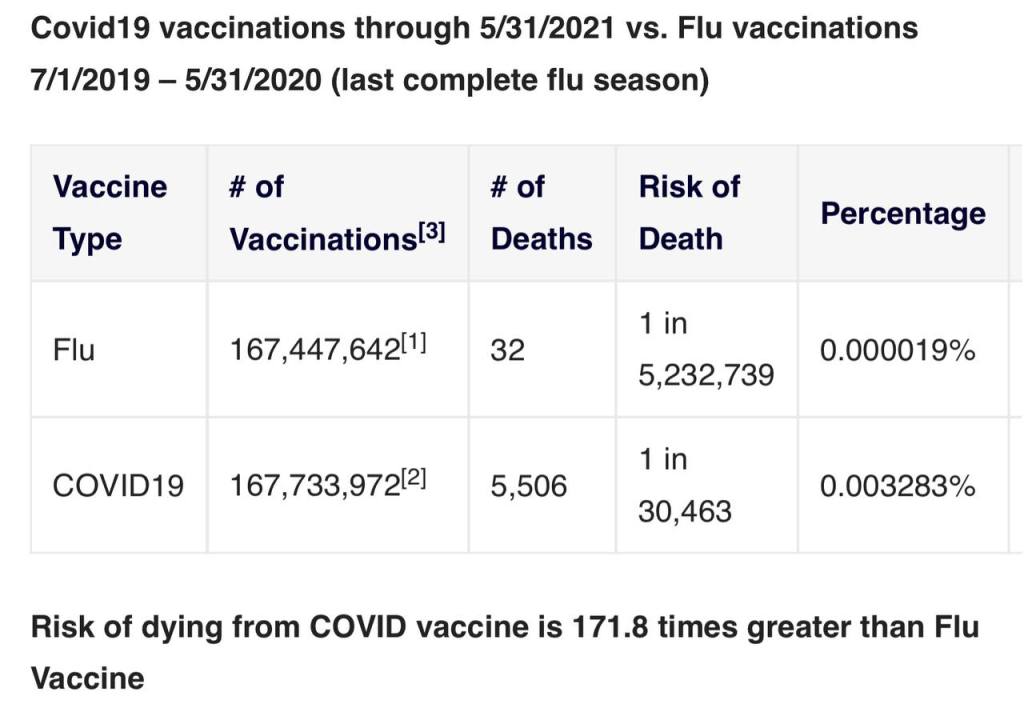
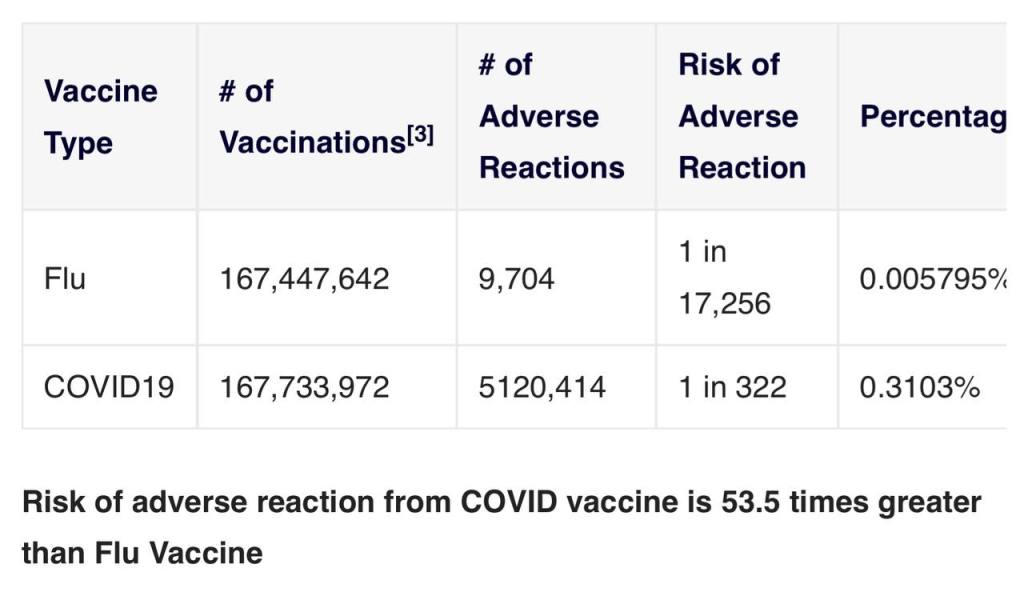
And the risk of adverse reaction from COVID vaccine is 53.5 times greater than Flu Vaccine
VAERS Summary for COVID-19 Vaccines through 10/29/2021
Nov 5, 2021 Download as PDF
All charts and tables below reflect the data release on 10/29/2021 from the VAERS website, which includes U.S. and foreign data, and is updated through 10/22/2021
| High-Level Summary | COVID19 vaccines (Dec’2020 – present) | All other vaccines 1990-present | US Data Only COVID19 vaccines (Dec’2020 – present) |
US Data Only All other vaccines 1990-present |
|---|---|---|---|---|
| Number of Adverse Reactions | 856,919 | 845,019 | 634,609 | 741,881 |
| Number of Life-Threatening Events | 20,110 | 13,800 | 9,726 | 9,795 |
| Number of Hospitalizations | 88,910 | 79,519 | 38,818 | 38,476 |
| Number of Deaths | 18,078* | 9,215 | 8,284 | 5,178 |
| # of Permanent Disabilities after vaccination | 28,112 | 19,929 | 9,580 | 12,615 |
| Number of Office Visits | 133,972 | 46,456 | 121,100 | 44,979 |
| # of Emergency Room/Department Visits | 95,898 | 211,090 | 79,615 | 202,004 |
| # of Birth Defects after vaccination | 610 | 153 | 363 | 97 |
*Note that the total number of deaths associated with the COVID-19 vaccines is greater than the number of deaths associated with all other vaccines combined since the year 1990.
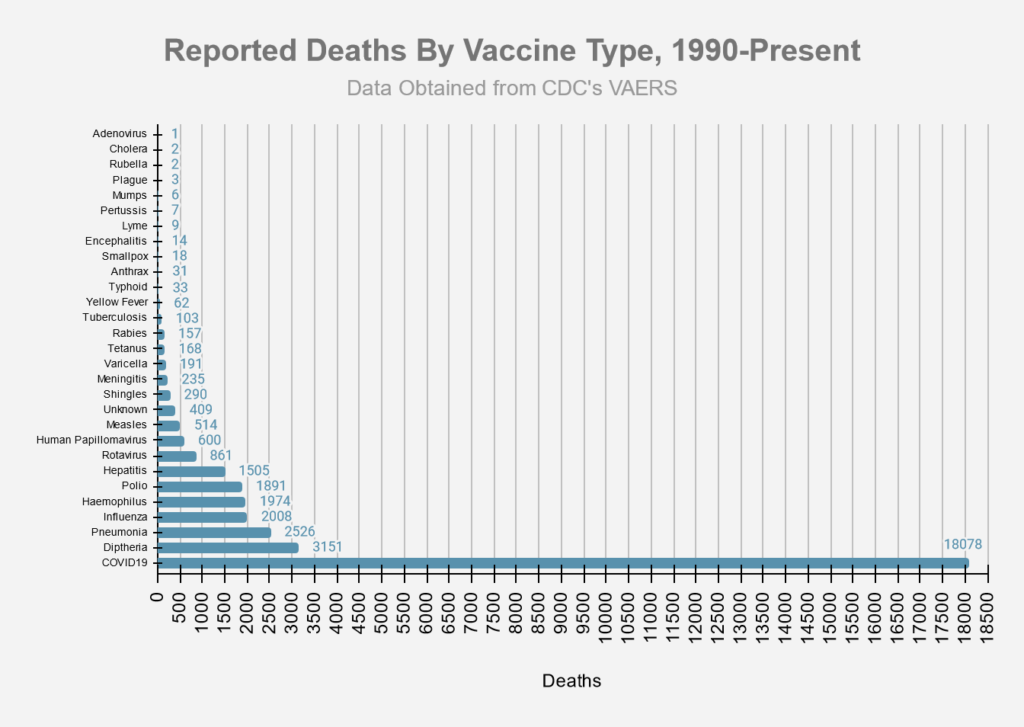
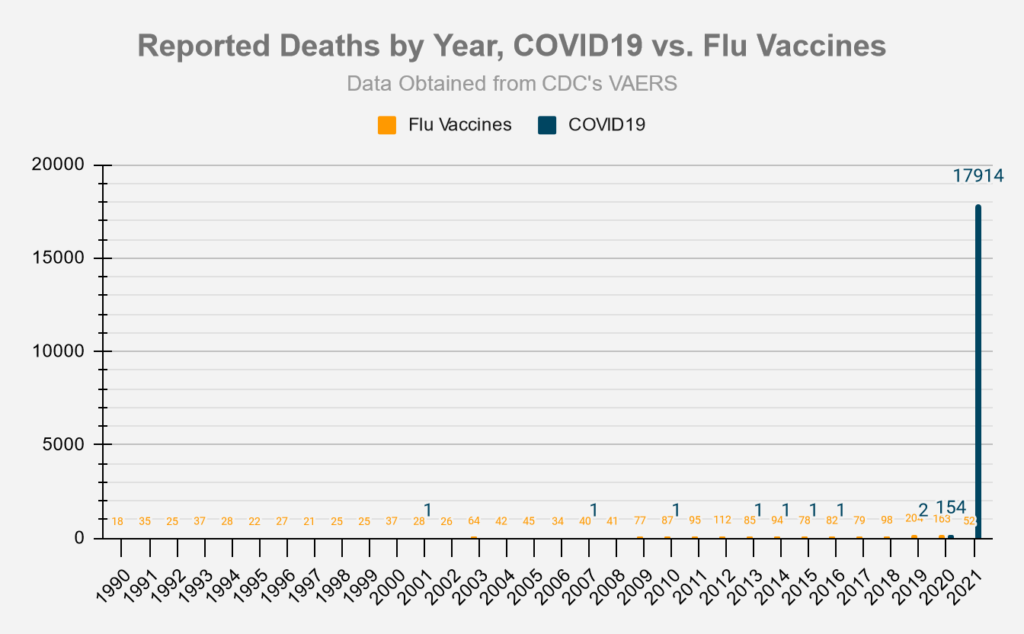
Deaths
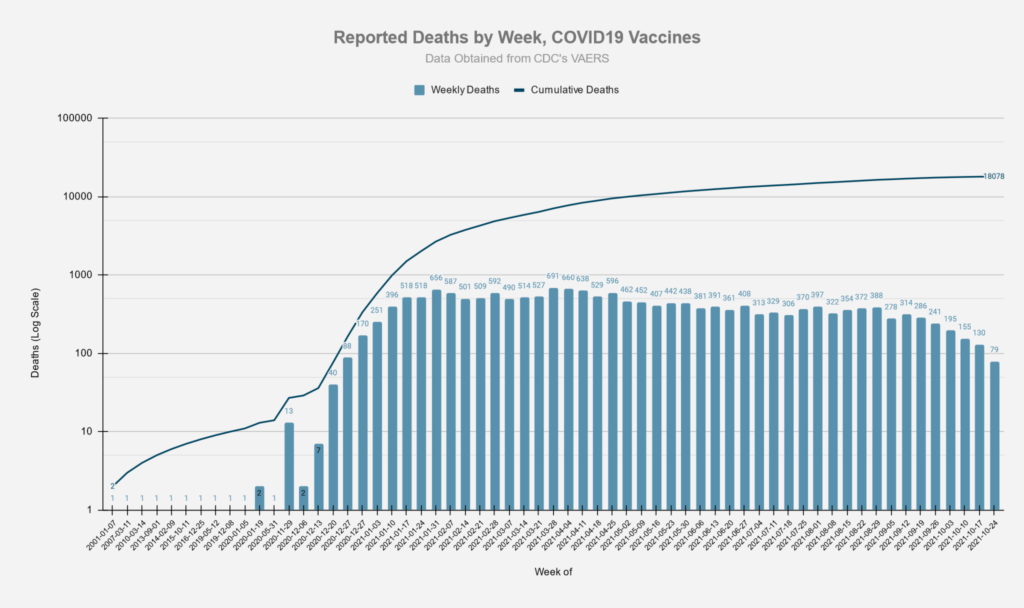
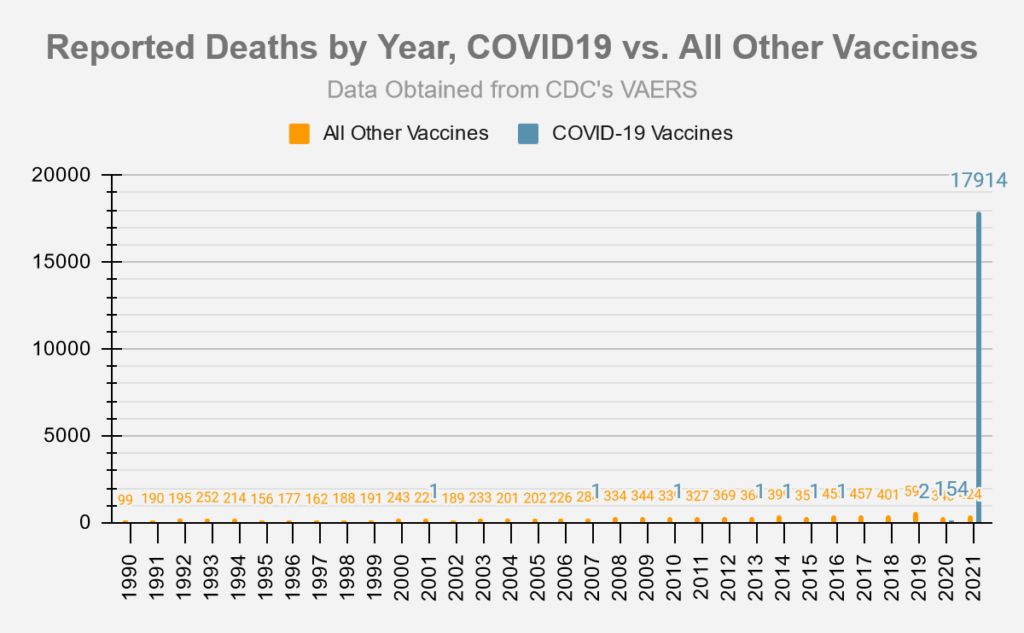

Chart using comparable 9 month periods, since Covid-19 vaccines have only been available for approximately 9 months:


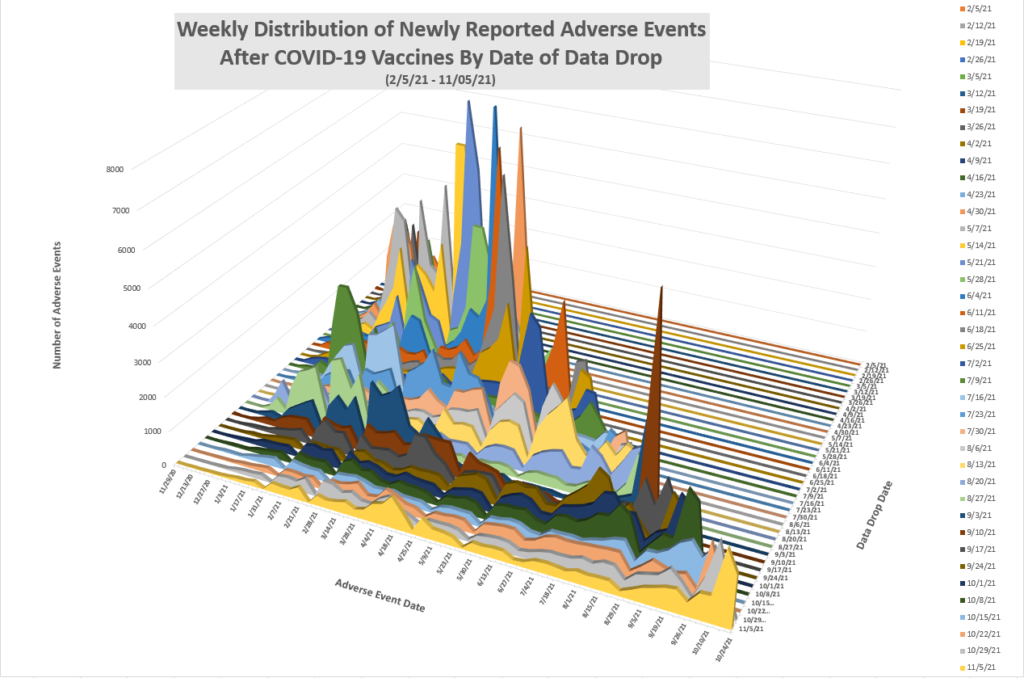
Adverse Events

Chart using comparable 9 month periods, since Covid-19 vaccines have only been available for approximately 9 months:


Symptoms
The slide below was taken from an FDA document from October 22, 2020, and provides a list of possible adverse event outcomes related to the Covid-19 vaccines.

The following table lists the number of adverse events found in the VAERS data which match the outcomes listed above:
| FDA Listed Symptom | Total (Non-Lethal) Adverse Events | Total Deaths |
|---|---|---|
| Guillain-Barre | 1592 | 28 |
| Acute Disseminated Encephalomyelitis | 110 | 3 |
| Transverse Myelitis | 283 | 1 |
| Encephalitis | 1312 | 125 |
| Convulsions/Seizures | 10849 | 321 |
| Stroke | 10175 | 942 |
| Narcolepsy, Cataplexy | 210 | 4 |
| Anaphylaxis | 37894 | 150 |
| Acute Myocardial Infarction (Heart Attack) | 2918 | 916 |
| Myocarditis/Pericarditis | 9922 | 123 |
| Autoimmune Disease | 891 | 18 |
| Other Acute Demyelinating Diseases | 209 | 2 |
| Pregnancy and birth outcomes (Miscarriages) | 2589 | 77 |
| Other Allergic Reactions | 1639 | 3 |
| Thrombocytopenia | 3551 | 271 |
| Disseminated Intravascular Coagulation | 156 | 45 |
| Venous Thromboembolism | 15667 | 875 |
| Arthritis and Arthralgia/Joint Pain | 56487 | 170 |
| Kawasaki Disease | 36 | 1 |
| Systemic Inflammatory Response Syndrome | 484 | 35 |
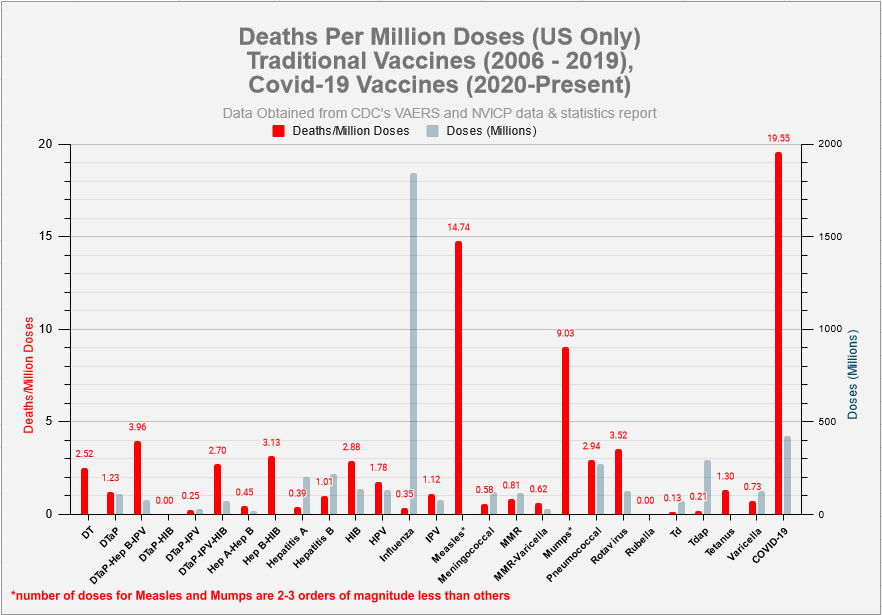
This set of figures compare the COVID19 vaccine to the traditional Flu vaccines. ‘Risk of Death’ percentages depend on the ‘# of Vaccinations’ data, which is only approximate, and was pulled from the CDC’s report on Flu vaccination coverage for the 2019-2020 season, and from Our World in Data for the COVID19 vaccinations.
Covid19 vaccinations through 5/31/2021 vs. Flu vaccinations 7/1/2019 – 5/31/2020 (last complete flu season)
| Vaccine Type | # of Vaccinations[3] | # of Deaths | Risk of Death | Percentage | Deaths/Mill. Vaccinations[3] |
|---|---|---|---|---|---|
| Flu | 167,447,642[1] | 32 | 1 in 5,232,739 | 0.000019% | .19 |
| COVID19 | 167,733,972[2] | 5,506 | 1 in 30,463 | 0.003283% | 32.83 |
The risk of dying from the COVID vaccine is 171.8 times greater than Flu Vaccine
| Vaccine Type | # of Vaccinations[3] | # of Adverse Reactions | Risk of Adverse Reaction | Percentage | AEs/Mill. Vaccinations[3] |
|---|---|---|---|---|---|
| Flu | 167,447,642 | 9,704 | 1 in 17,256 | 0.005795% | 57.95 |
| COVID19 | 167,733,972 | 5120,414 | 1 in 322 | 0.3103% | 3,103 |
The risk of adverse reaction from the COVID vaccine is 53.5 times greater than Flu Vaccine
[1] number of flu vaccinations based on estimated flu vaccine coverage data from CDC and estimated population data from the US Census. Yearly flu vaccination data covers a period of time from 7/1 to 5/31 of the following year.
[2] number of covid19 vaccinations based on estimates from Our World in Data [2] number of covid19 vaccinations based on estimates from Our World in Data
[3] Persons vaccinated with at least one dose.
Vaccine Data by Manufacturer
| Manufacturer | # of Deaths | % Deaths | Average Deaths/Day | # US Deaths | US Doses Administered | Average US Deaths/Mill. Doses | Days since EUA approval | EUA Approval Date- |
|---|---|---|---|---|---|---|---|---|
| Janssen (JNJ) | 1435 | 7.93% | 5.86 | 920 | 15,774,846 | 58.32 | 245 | 2/26/2021 |
| Moderna | 4431 | 24.5% | 14.07 | 3532 | 161,206,881 | 21.91 | 315 | 12/18/2020 |
| Pfizer/Biontech | 12158 | 67.22% | 37.76 | 3802 | 249,302,522 | 15.25 | 322 | 12/11/2020 |
| Unknown | 64 | 0.35% | 37 | 443,843 |
| Manufacturer | # of AEs | % AEs | Average AEs/Day | # US AEs | US Doses Administered | Average US AEs/Mill. Doses | Days since EUA approval | EUA Approval Date |
|---|---|---|---|---|---|---|---|---|
| Janssen (JNJ) | 65444 | 7.63% | 267.12 | 57630 | 15,774,846 | 3653.28 | 245 | 2/26/2021 |
| Moderna | 322655 | 37.6% | 1024.3 | 293856 | 161,206,881 | 1822.85 | 315 | 12/18/2020 |
| Pfizer/Biontech | 468217 | 54.56% | 1454.09 | 282753 | 249,302,522 | 1134.18 | 322 | 12/11/2020 |
| Unknown | 1831 | 0.21% | 1429 | 443,843 |
Vaccine Data by Gender

Vaccine Data by Location


Sources
- Vaccine data (Covid-19 and other vaccines) taken from CDC’s VAERS website, located here: https://vaers.hhs.gov/data/datasets.html. VAERS data sets in the form of csv files are pulled down weekly and put into a database for reporting/analysis. Data files are available all the way back to 1990.
- Number of doses distributed for other vaccines found in NVICP Data and Statistics report here: https://www.hrsa.gov/sites/default/files/hrsa/vaccine-compensation/data/data-statistics-report.pdf
- Numbers for Covid-19 vaccines administered by the manufacturer found here: https://covid.cdc.gov/covid-data-tracker/#vaccinations_vacc-total-admin-rate-total
- Numbers for total Covid-19 vaccine doses administered found here: https://data.cdc.gov/Vaccinations/COVID-19-Vaccination-Trends-in-the-United-States-N/rh2h-3yt2
- Numbers for Flu vaccine doses administered for 2019-2020 season found here: https://www.cdc.gov/flu/fluvaxview/coverage-1920estimates.htm
 Posted in
  Tags:
Tags: 


