 RSS Feed


 July 6th, 2023
  Awake Goy
 Let’s go back to look at the impact of the pandemic response on the economy by comparing employment over time between two states.
It’s well known that employment has impacts on not just an individual’s economic outlook, but their health as well. The idea that we could have somehow suppressed the economy in favor of preventing mortality and impact to health was a false trade-off. The cost of destroying livelihoods has impacts on health and life expectancy.
This was well-established in Public Health, yet was constantly ignored by lockdowners. Knowing that the lockdowns completely failed to prevent or even reduce Covid spread and mortality, it was clear by mid-2020 that there could only be net harm by adding economic hardship onto the already existing burden of the virus itself.
By now you might have guessed that the states we are comparing: California vs. Florida. In previous articles, we looked at Mobility and Mortality in order to test whether or not compelling individuals to “stay home save lives” actually worked. We now have a wealth of research showing the ineffectiveness of lockdowns, yet this reality was abundantly clear even in the midst of the pandemic, as real-time data was able to show its failure in real time.
Now let’s take a look at the immediate and long-term impacts of lockdown policies on employment. The graphs below show how the employment rates have changed over time relative to just before the pandemic. (This allows us to compare each state to itself, which can serve as a control for other differences between them).
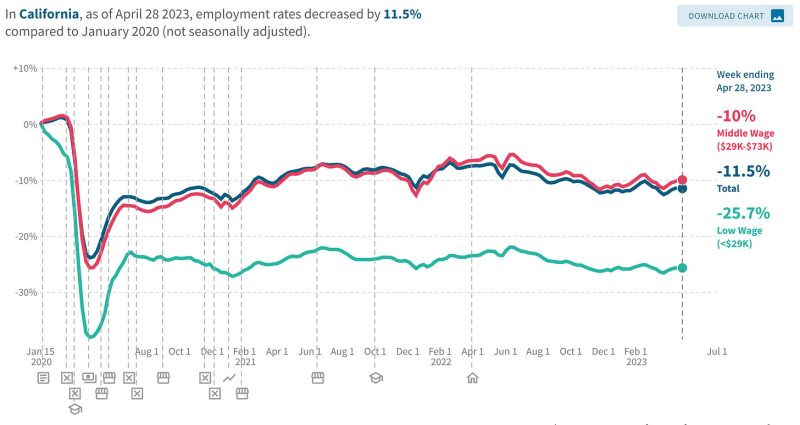
Lockdown State: California – Employment Change Over Time.
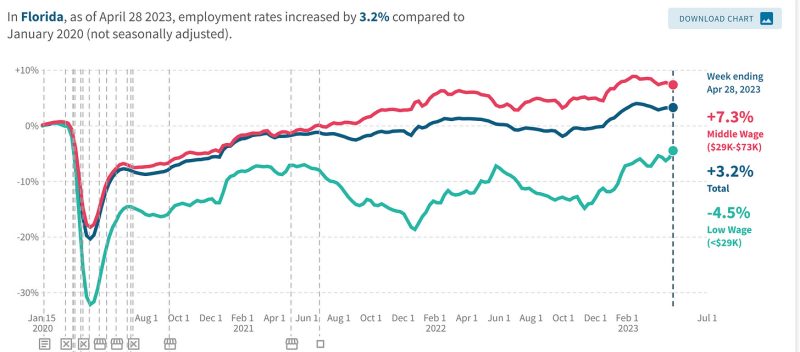
Free State: Florida – Employment Change over Time
source: https://tracktherecovery.org/
Florida not only outperformed California during the pandemic, but has increased their overall employment relative to January 2020 by 3.2 percent. California has remained 11.5 percent below their pre-pandemic levels, and ever worse – low-wage employment is down 25 percent and is trending downward.
In closing, we’re only just starting to tally the collateral damage done by the policy response to Covid. This series of articles has not even scratched the surface of the effects on education, mental health, childhood development, and many other areas of impact. For a comprehensive comparison of each state – I recommend this paper by Phil Kerpen et al, which ranks each state by objective, standardized metrics. Florida comes in at # 6, while California ranks #47.

source: A Final Report Card on the State’s Response to Covid-19
I choose optimism and hope. Knowing that as far as the data is concerned, freedom is better.
Reposted from the author’s Substack

 Posted in
  Tags:
Tags: 


