 RSS Feed


 December 22nd, 2023
  Awake Goy
 Final Q3 GDP, Personal Consumption Revised Sharply Lower As Core PCE Slumped To 2.0%
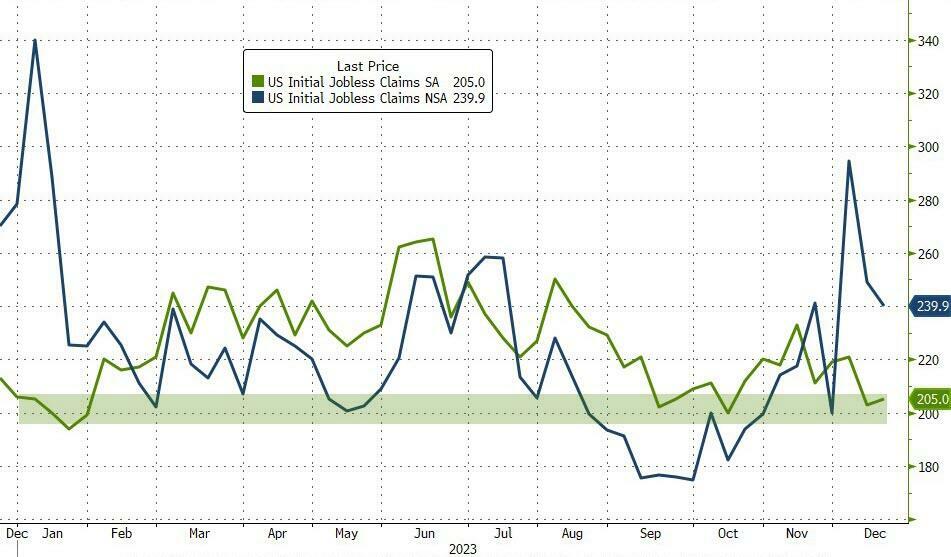
Normally the market could care less about data that is at least 3 months old, like for example today’s 3rd estimate of Q3 GDP for the quarter ended Sept 30 or, well, three months ago, but on days like today when algos are desperate for bad news to validate the Fed’s dovish pivot and extend on premarket gains, it appears that everyone ignored the very strong initial claims print which came in near record lows…
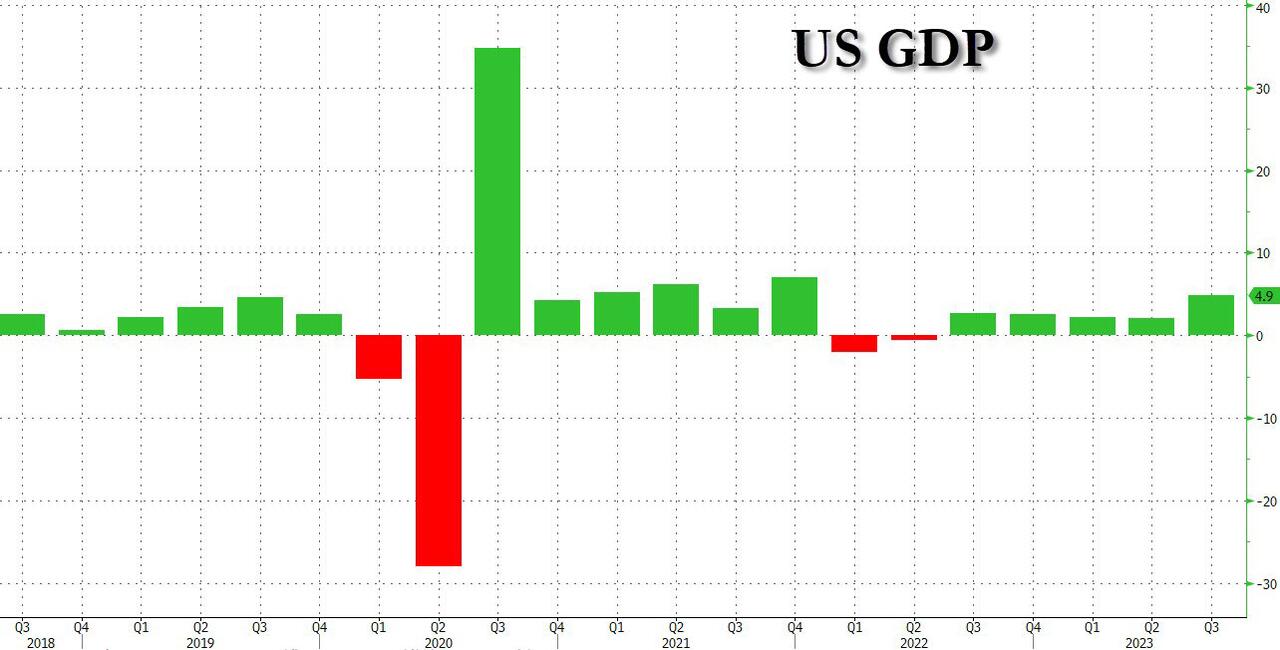
… and instead focused exclusively on both the GDP number, which at 4.9% (or 4.86% to be precise) was revised sharply lower from the 5.2% reported in the 2nd estimate (and below the 5.2% estimate), as well as the Core PCE Print which at 2.0% was a big drop from the 2.3% previously (and expected) and right in line with the Fed’s inflation target.
According to the BEA, “the increase in the third quarter primarily reflected increases in consumer spending and inventory investment. Imports, which are a subtraction in the calculation of GDP, increased.”
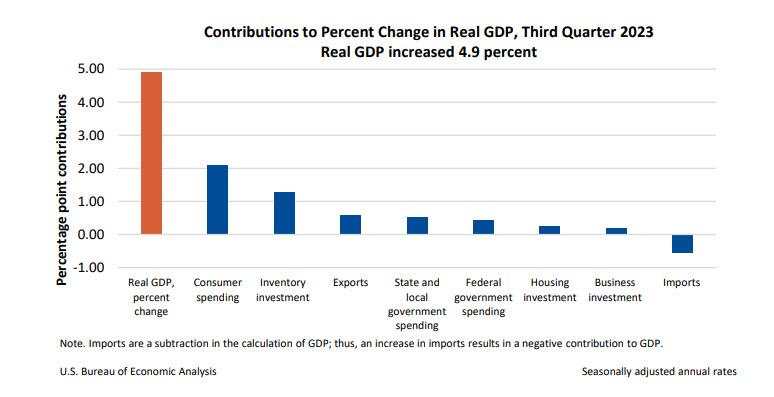
The update from the “second” estimate reflected downward revisions to consumer spending, inventory investment, and exports that were partly offset by upward revisions to state and local government, business investment, housing investment, and federal government spending. Here are some more details:
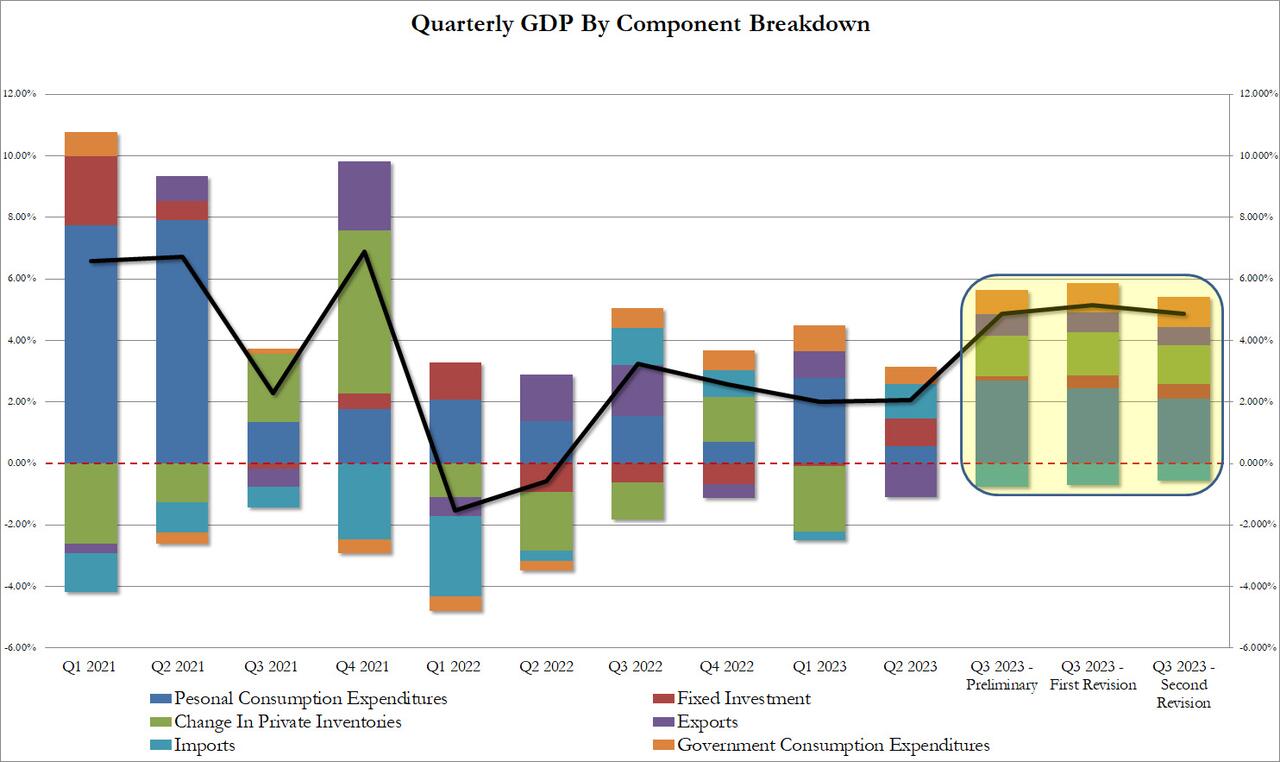
- Personal consumption was revised down to 2.11% of the bottom line GDP print, from 2.44% in the second estimate and 2.69% in the first. So par for the course for the
Obama 3.0Biden admin. - Fixed Investment was 0.46% of GDP, up from 0.42%
- Change to Private Inventories added 1.27%, down from 1.40% previously
- Net exports were a tiny contribution of 0.03% (0.59% exports vs -0.56% imports), a flip from the modest drag of -0.04% in the second estimate
- Government consumption added 0.99%, up from 0.94% in the second estimate
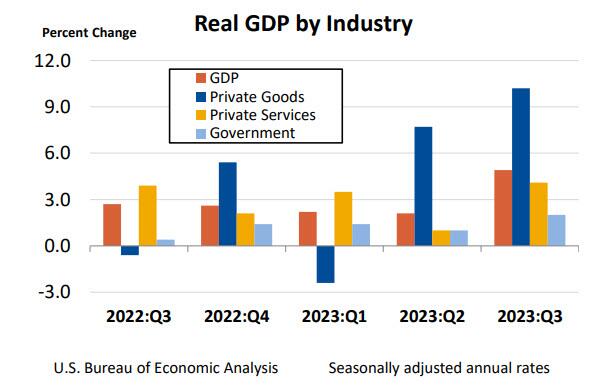
Visually, the data looked like this:
In Q3, the value added of private goods-producing industries increased 10.2 percent, private services-producing industries increased 4.1 percent, and government increased 2.0 percent. Overall, 14 of 22 industry groups contributed to the third-quarter increase in real GDP.
- Within private goods-producing industries, the increase was led by nondurable goods manufacturing and construction.
- Within private services-producing industries, the increase was led by retail trade, information, and finance and insurance. Partly offsetting these increases was a decrease in utilities.
- The increase in government reflected an increase in state and local government that was partly offset by a decrease in federal government.
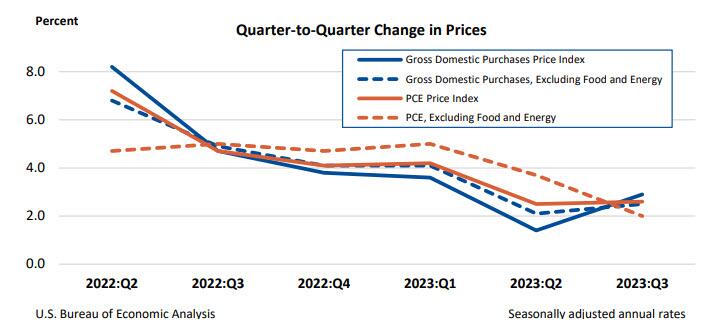
But even more important than the (meaningless) GDP components was the price data, which came far weaker than expected and was a notable drop from the previous estimate, to wit:
- GDP Price Deflator 3.3%, Exp. 3.6%, Last 3.6%
- PCE Prices 2.6%, Last 2.8%
- Core PCE Price Deflator 2.0%, Exp. 2.3%, Last 2.3%
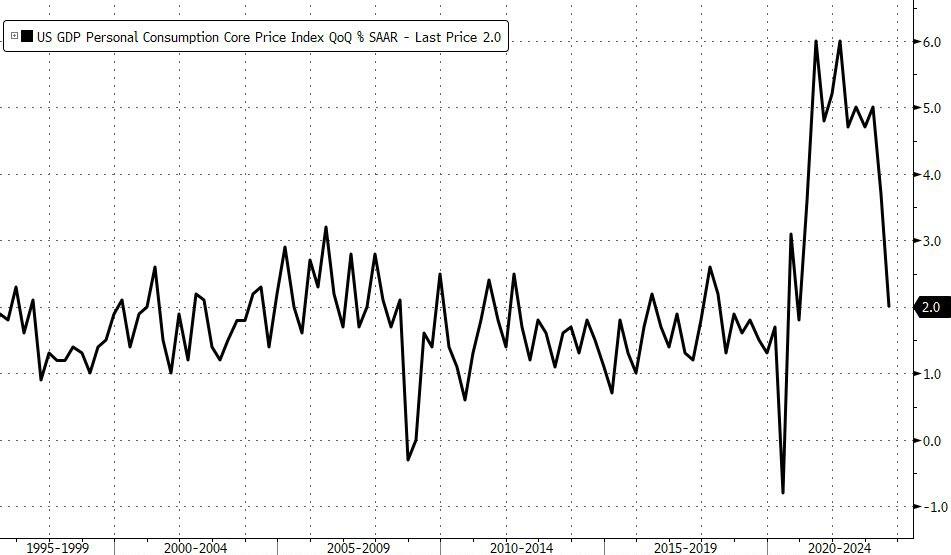
Translation: three months ago, when the Fed was still pointing to more rate hikes in 2023, core PCE had already fallen to the Fed’s target and only the lack of “accurate” data is what apparently prevented the Fed from turning more dovish. Of course, the same lagged effect of accurate data is why the Fed’s rate cuts will be coming just as inflation is once again starting to run away to the upside, guaranteeing a catastrophic repeat of the 1970s Arthur Burns Fed.
Tyler Durden
Thu, 12/21/2023 – 09:11 Source
 Posted in
  Tags:
Tags: 


