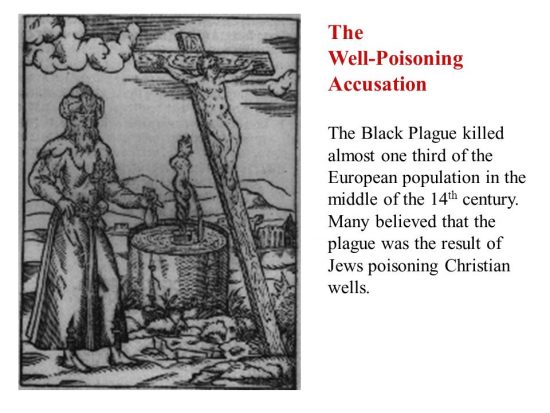
Intergovernmental Panel on Climate Change (IPCC) reports and comprehensive summaries of the peer-reviewed literature raise questions regarding the assumptions inherent in computer modelling of future climate changes, including the supposed linearity of future global temperature trends (Figure 1).
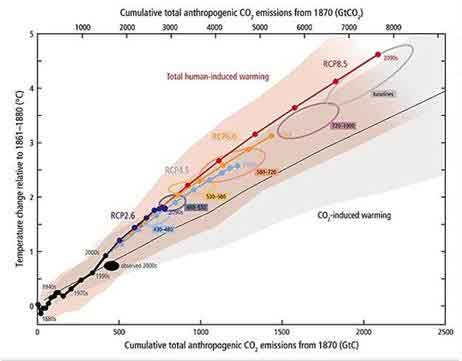
Computer modelling does not necessarily capture the sensitivity, complexity and feedbacks of the atmosphere-ocean-land system as observed from paleoclimate studies. Underlying published IPCC computer models appears to be an assumption of mostly gradual or linear responses of the atmosphere to compositional variations. This overlooks self-amplifying effects and transient reversals associated with melting of the ice sheets.
Leading paleoclimate scientists have issued warnings regarding the high sensitivity of the atmosphere in response to extreme forcing, such as near-doubling of greenhouse gas concentrations: According to Wallace Broecker, “The paleoclimate record shouts out to us that, far from being self-stabilizing, the Earth’s climate system is an ornery beast which overreacts to even small nudges, and humans have already given the climate a substantial nudge”. As stated by James Zachos, “The Paleocene hot spell should serve as a reminder of the unpredictable nature of climate”.
Holocene examples are abrupt stadial cooling events which followed peak warming episodes which trigger a flow of large volumes of ice melt water into the oceans, inducing stadial events. Stadial events can occur within very short time, as are the Younger dryas stadial (12.9-11.7 kyr) (Steffensen et al. 2008) (Figure 2) and the 8.2 kyr Laurentian cooling episode,
Despite the high rates of warming such stadial cooling intervals do not appear to be shown in IPCC models (Figure 1).
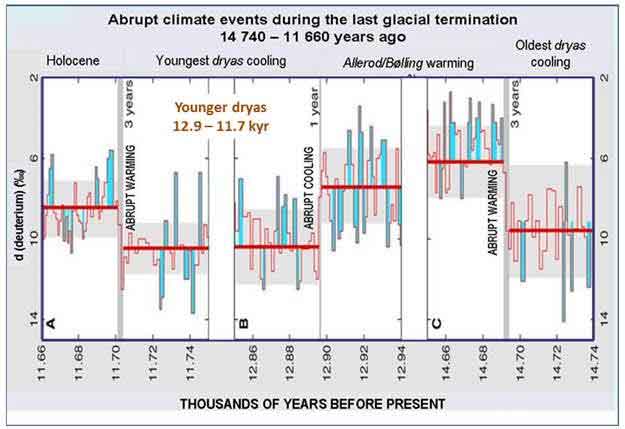
Comparisons with paleoclimate warming rates follow: The CO₂ rise interval for the K-T impact is estimated to range from instantaneous to a few 103 years or a few 104 years (Beerling et al, 2002), or near-instantaneous (Figure 3A). An approximate CO₂ growth range of ~0.114 ppm/year applies to the Paleocene-Eocene Thermal Maximum (PETM) (Figure 3B) and ~0.0116 ppm/year to the Last Glacial Termination (LGT) during 17-11 kyr ago (Figure 3C). Thus the current warming rate of 2 to 3 ppm/year is about or more than 200 times the LGT rate (LGT: 17-11 kyr; ~0.0116 ppm/yr) and 20-30 times faster than the Paleocene-Eocene Thermal Maximum (PETM) rate of ~0.114 ppm/year.
Therefore the term “climate change” for the extreme warming reaching +1.5°C over the continents and more than +3°C over the Arctic over a period of less than 100 years, requires reconsideration.
However, comparisons between the PETM and current global warming may be misleading since, by distinction from the current existence of large ice sheets on Earth, no ice was present about 55 million years ago.
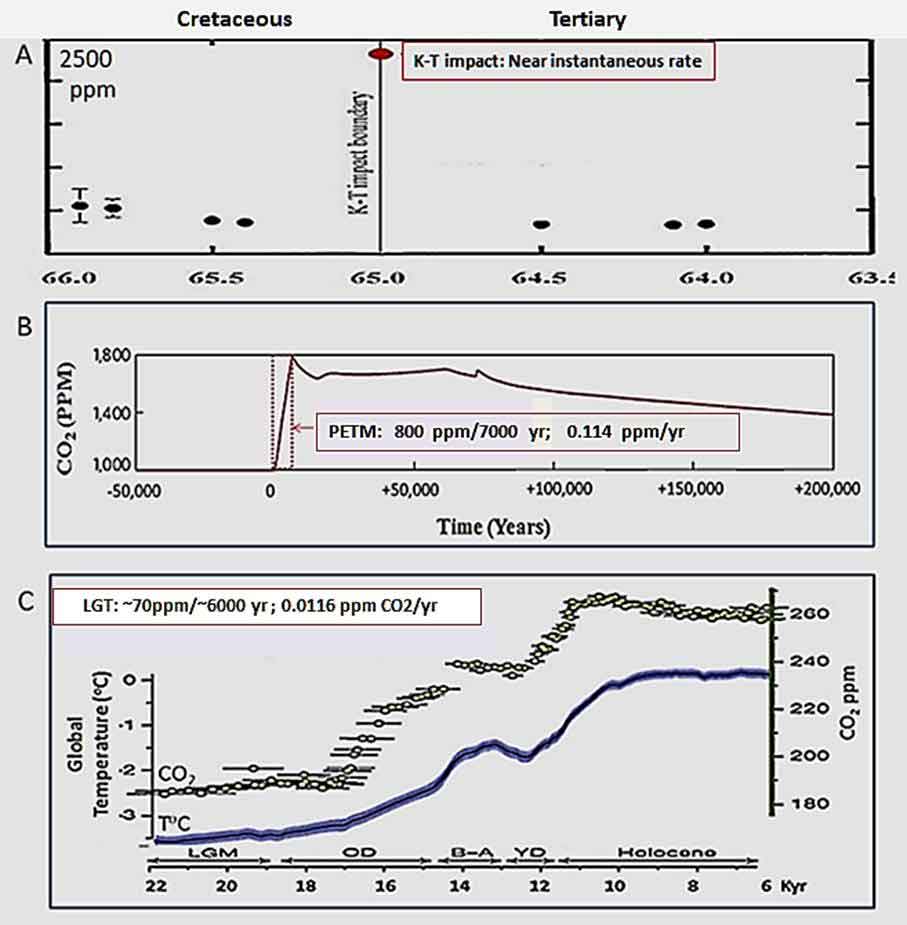 |
| Figure 3. (A) Reconstructed atmospheric CO₂ variations during the Late Cretaceous–early Tertiary, based on – Stomata indices of fossil leaf cuticles calibrated using inverse regression and stomatal ratios (Beerling et al. 2002); (B) Simulated atmospheric CO₂ at and after the Palaeocene-Eocene boundary (after Zeebe et al., 2009); (C) Global CO₂ and temperature during the last glacial termination (After Shakun et al., 2012) (LGM – Last Glacial Maximum; OD – Older dryas; BA – Bølling–Alerød; YD – Younger dryas) |
Observed climate complexities leading to the disturbance of linear temperature variations include:
- The weakening of climate zone boundaries, such as the circum-Arctic jet stream, allowing cold air and water masses to shift from polar to mid-latitude zones and tropical air masses to penetrate polar zones (Figure 4), induce collisions between air masses of contrasted temperatures and storminess, with major effects on continental margins and island chains.
- Amplifying feedbacks, including release of carbon from warming oceans due to reduced CO₂ solubility and therefore reduced intake from the atmosphere, release of methane from permafrost and from marine sediments, desiccated vegetation and extensive bush firesrelease of CO₂.
- The flow of cold ice melt water into the oceans from melting ice sheets—Greenland (Rahmstorf et al., 2015) and Antarctica (Bonselaer et al., 2018)—ensuing in stadial cooling effects, such as the Younger dryas and following peak interglacial phases during the last 800,000 years (Cortese et al., 2007; Glikson, 2019).
 |
| Figure 4. Weakening and undulation of the jet stream, shifts of climate zones and penetration of air masses across the weakened climate boundary. NOAA. |
In the shorter term such international targets as “zero emissions by 2050” apparently do not include the export of petroleum, coal and gas, thus allowing nations to circumvent domestic emission limits. Australia, the fifth biggest miner and third biggest exporter of fossil fuels, is responsible for about 5% of global greenhouse gas emissions.
At present the total CO₂+CH₄+N₂O level (mixing ratio) is near 500 ppm CO₂-equivalent (Figure 5). From the current atmospheric CO₂ level of above ~415 ppm, at the rise rate of 2 – 3 ppm/year, by 2050 the global CO₂ level would reach about 500 ppm and the CO₂-equivalent near 600 ppm, raising mean temperatures to near-2°C above preindustrial level, enhancing further breakdown of the large ice sheets and a further rise of sea levels.
 |
| Figure 5. Evolution of the CO₂+CH₄+N₂O level (mixing ratio) |
Andrew Y Glikson is an Earth and climate scientist
IF YOU LIKED THE ARTICLE SUPPORT PEOPLE’S JOURNALISM
Related posts:
Related posts:
Views: 0
 RSS Feed





 February 13th, 2021
  Awake Goy
  Posted in
  Tags:
Tags: 

